
Introduction
An ascending progression from data to information and knowledge is the process of converting heaps of raw details to make sense of them. There are humongous pieces of puzzles lying around in our workplace and homes. To record, contact data from your rolodex to your personal computer requires a set of structure such as rows and columns to input name, address, phone number and email as basic details. Perhaps add birthdate reminders in there too, so you will never miss them.
To keep such records requires a tool, and according to the CEO of Microsoft there are 750million over users of this unique tool called MICROSOFT EXCEL. It is a spreadsheet which helps in capturing data and converting them into information and intelligence. There have been newer updated versions of the Microsoft Office 365 Suite. EXCEL which was first introduced in 1985, is unique as it turns data into insights. Although Microsoft had introduced business analytic tool called Power BI, the basic foundation in deriving business intelligence originates from mastering skills of using Microsoft EXCEL.
EXCEL for Business Intelligence
The evolution of analyzing information and making sense from it is purposive of business intelligence. Often C- Suite leaders rely on Executives to supply this information and analytics in order for them to make informed decisions. Investments in software and applications for data management will yield no impact if executives working with data set input and analysis are not able to rearrange them nor realign them to correspond with organizational goals. With poor data management skills, predictions for solutions that serves business strategies will turn out wrong. And often employees don’t know what they did not know until they are taught the skill and knowledge necessary to manage their job well.
Consequently, working executives and professionals need to master the use of this EXCEL tool to be able to report, analyze, monitor and predict using data for delivering better business intelligence. As Abraham Lincoln was once quoted as saying, “Give me six hours to chop down a tree and I will spend the first four sharpening the axe.” Therefore, improving your skills in using EXCEL will maximize solutions derived from working with data for improving operational efficiencies as well as increasing competitive advantages.

Data Creation and Analytics
Data is sets of details and a collection of them derive outcomes. For Conference Organizers, collecting data about their participants will help to increase their database for future events. Information is derived on the concentration of designation of participants’ or even the type of company they represent (MNCs or SMEs). This is an easy method to bring data together to direct your business focus. In the next event, the marketing team may decide to increase the number of SME participation as that segment represents the largest business population in Malaysia. This is intelligence, and it enables the company its Marketing team, to take a step further in using information to drive future decisions.
In the process of working with intelligence the conference organizer will now plan for number of events, ad spend, or marketing campaigns targeted to SME businesses predictions can be made to collaborate with regional SME associations to market their future conferences in other regions and markets. Such interactions with data sets (database of associations/ emails/ contact numbers) are examples of items to be derived from records of past participants. Analyzing data is one of the common reasons why any employee would open up the EXCEL sheet.
Have you Mastered the 3 Levels of Excel?

Mastering skills in using EXCEL can be tricky as a lot of it is related to application. Although there are 3 levels of mastery- Basic, Intermediate and Advanced neither you nor employers can beforehand determine capabilities in managing these levels of comprehension without application experience. Becomes imperative that you understand the different levels of EXCEL skills so actions can be taken to achieve mastery according to your career goal.
Although during an interview for a manager’s role, there are consulting firms that request candidates to demonstrate expertise in budgeting functions and Excel features that help to solve case problems.
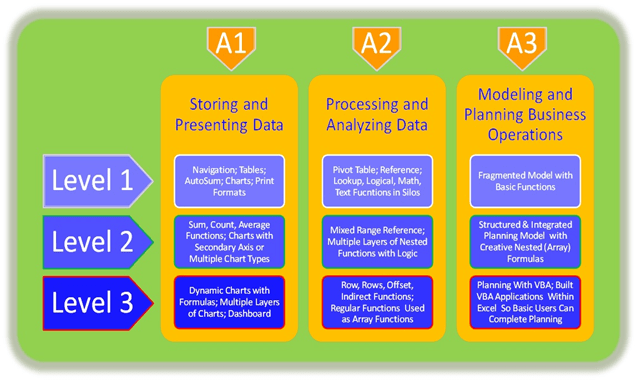
Overall EXCEL competency lies in performing 3 types of activities as illustrated in Diagram 1.0 Advance Excel.
| A1 – Storing and Presenting Data A2 – Processing and Analyzing Data A3 – Modeling and Planning Business Operations |
For each of the three activities, there are three levels of skills involved, labelled as Level 1, 2 and 3.
| A1 – Storing and Presenting Data At this level much involves representation of information. EXCEL is used to store data for various functions such as sales, marketing, production, HR, payroll, in table formats or charts with various shapes, size, and color differentiators. |
| A2 – Processing and Analyzing Data Here connections among those data is shown. Marketing data should correspond with sales results. HR payroll data should correspond with production numbers. Those numbers correspond with the state of business – up or down, increase or decrease. Such quantum will help Managers/ presenters make sense of the data. |
| A3 – Modeling and Planning Business Operations This is level where intelligence is derived. In the example of the production line, when higher sales is captured, production line needs to be stretched either to work longer hours or with additional production lines and workers. Therefore this will results in higher payroll numbers therefore forecast and planning is based on scenario analysis. Business operation is planned, sound solutions are found to keep costs low as befitting with competitive strategy – in keeping price low. |
Each levels of interventions by people and experts who manage EXCEL data is described as Level 1, Level 2 and Level 3.
| Level 1 At this level people who know how to navigate through the EXCEL software and generate nice tables with fancy colors and filter features to present the data in line charts, bar or pie charts is the expected skill level. However, more advance level presentations linked to the purpose and aim of the presentation is the differentiating factor in competency level of employees who can use EXCEL at Level 1 competency. |
| Level 2 At this level some numeric data formatting and alignment skills is necessary. They can design various controls to do drop down lists and customize the cell formatting for currency and value to an accurate figure. Their ability to adjust almost any element of a chart to present numbers interactively would be that extra skills of employees who demonstrate competence in Level 2. |
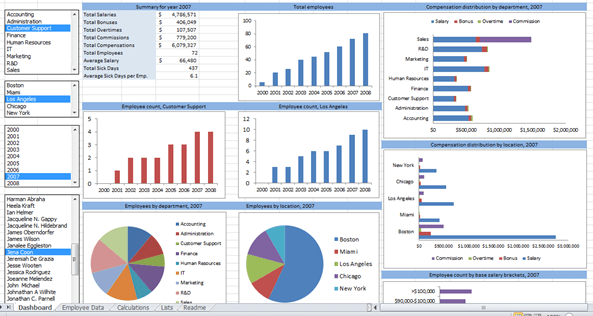
| Level 3 Level 3 competencies is reflected in the knowledge of storage and extraction of encrypted data from a server file. Some even know how to manage the SQL servers. Although EXCEL presentations are the interface data retrieval for processing and restorage requires mindfulness and adherence to security protocol especially when dealing with financial information. Employees who is able to export data into dashboards to show state of reports and charts involving complicated formulas aggregators and multiple layers of charts constitute someone with Level 3 competent skills. |
The combination of Levels and Skills appear in the way data is manipulated, presented. Ranges of data used to look up on any criteria where the data set lies using specific functions are the next level of presenting flowcharts and nested formulas. Calculations that are sorted to make sense for decision making using complex functions and running assumed models are all combined use of the ADVANCE EXCEL skills.
Project Management with EXCEL
A continuum between data to intelligence varies by function for accurate decision-making. EXCEL has almost 470 over formulas to process data and construct solutions to any business problem. Every academic researcher or project management professional is ever familiar with this terminology Gantt Chart. This is a tool to track schedules and activities of a project. The milestones of the project and the required expertise and required resources can be tracked using the Gantt Chart. It is a 1 page reference to the entire communication of a project.
An EXCEL Gantt Chart helps to
- Design reports for your stakeholders
- Create a dashboard with some common project management requirements
- Enhance project communications with charts
- Automate reporting
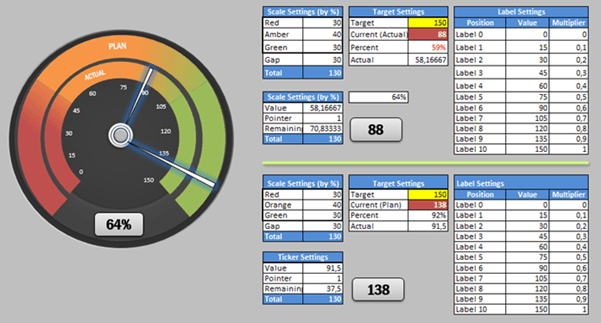
Creative additions include a Microsoft EXCEL Camera Tool for project milestone updates including a speedometer chart for illustrative reporting.
EXCEL in Financial Modelling
Using EXCEL is a common practice in finance and accounting roles. However, to be an expert finance professional you need to master the skills required in Financial modelling using ADVANCE EXCEL. Although job descriptions rarely include the exact level of EXCEL competencies required for the job, there are core skills required to be able to progress professionally on the job- by becoming a competent EXCEL user.
Investment bankers have Excel incorporated as CPD programmes for license renewal. These bankers also attend networking events endlessly to gather insights and engage in practical industry conversations. In doing so, numerous databases of information need to be categorized. As such knowledge in address searches using HLOOKUP to identify the right expertise for your future networking and engagements are vital tools.
Equity researchers find EXCEL an inevitable tool to address analysis in specific areas such as financial valuation models. Scenario studies assess costing repercussions in mergers and acquisitions. Financial modelling is also useful to anticipate outcomes of any distress to the finance system.
Real Estate Investment Trust (REIT) businesses are highly tuned to meeting needs of investor communities and business stakeholders. Sales of spaces for a regional warehouse, global multisite manufacturing and logistics support business. To seal a deal on Real Estate Investment, marketing activities have to be planned and supported well with accurate data. Using Advance EXCEL employees will not only meet with regulatory requirements in relocation and land ownerships but also be able to leverage on the various investors listings by getting them easily arranged on a single page. Using Conditional formatting, each asset can be evaluated to suit requirements and pique the interest of various investors by formatting data appropriately. In case of acquisitions and valuations high level competencies and knowledge is required in development of bespoke projects plans. Being able to statistically present valuation such as Nett Present Value and the IRR function is a financial function that highlights internal rate of return for a series of cash flows that occur at regular intervals. Using Array formats to reference the cells to value of assets will give clear directions to investors in making their investment decisions. Hence Advance EXCEL Skills in data formatting can become highly useful.
For less complex roles in banking, often employees are accustomed to systems which has integrated EXCEL formats to serve banking customers. These information could be permutated to address specific requests from in interest calculations or probability calculations of losses in loans by segment of customers therefore employees who are equipped with Advance EXCEL skills, can easily help SMEs customers with their enquiries. In going the extra mile by fulfilling customer requests, new credit line or products and services can be sold by frontline service employees, if they are equipped with the right skills in using EXCEL.
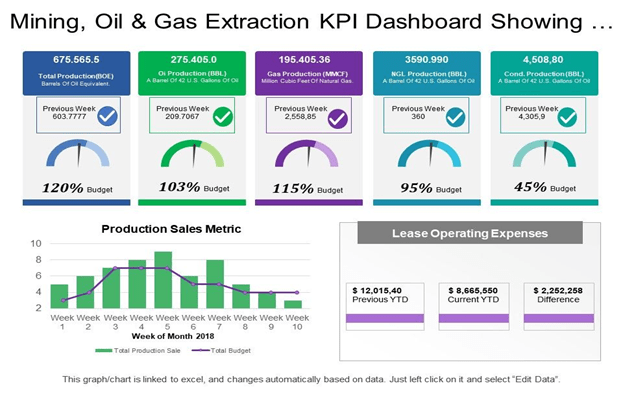
Oil and Gas Resource Costing Models
Oil and gas is an ‘oligopoly’. Few producers who supply to a large number of syndicated consumers- from government to oil and gas distribution channels. Therefore, this sector is supply and price sensitive. Hence EXCEL skills is all the more imperative for anyone working in oil and gas as all responsibilities and roles have be mindful of this price sensitive character of this sector and its players.

In times of austerity and job cuts take place, the Head of Talent Management in an oil and gas sector, would need to draw up recommendations for jobs to cut. Often such decisions are made with competency data by formatting by function and competencies of employees whether involved in upstream or downstream jobs. Based on the needs of the company to competency assessment is key criteria for elimination and often if one is equipped with High level competencies in EXCEL related to critical decision making functions in the oil and gas sector- one that cannot be replaced by machine learning, often this job is saved.
The entry level requirement for jobs in the oil and gas industry is commonly a Bachelor’s degree. In acquiring a degree, the level of skills in applied EXCEL is low because the incumbent is not on the job yet. Therefore, it is essential that once on the job employees pick up on information communication and technologies to support services. Advance EXCEL is an essential skill in oil and gas industry whether one works in jobs related to mechanic and repair technologies, engineering-related jobs, geoscience or even precision production. Oil and gas is all about natural resource management and energy supply. Investments in distribution channels downstream and extraction technologies upstream is evaluated using modelling and Advance EXCEL provides the foundations for such model analysis.
Supply chain for oil and gas consequentially are producers, refiners, pipeline and distributions operators and consumers. Here is how a recent report read. ‘Oil market expert and former BP statistical modeler Mark Finley envisioned a similar drop. Finley told S&P Global Market Intelligence that even if Russia and Saudi Arabia agree to cut back production, the lack of demand could still overwhelm global storage. “In our base case, transport fuel demand could fall as much as 70% in affected regions.
The role of statistical modelling is so eminent in this industry. Using functions in Advance EXCEL such as ‘what if’ analysis one can reverse calculate variables such Implied volatility in oil pricing and barrel production to forecast. Pivot tables are a powerful tool to master in which will allow you to organize, sort, and filter data in a very flexible style.
EXCEL in Retail
From purchases to inventory and pricing in retail industry, tracking movement of goods predominantly drove the need for EXCEL software in this sector. However, the robustness of EXCEL is the Macro application that allows for vast amounts of data to be input and processed for monitoring inventory by supply chain vendors to discounts and payment terms are illustrated for better, faster decision making. EXCEL as a service also helps to record information about staff and tracks their daily attendance apart from calculating their salaries and overtime payments. All this with the click of a button, on Microsoft EXCEL you can run the Macro application on the same spreadsheet.

One of the key challenges in retail is the retention of its workforce with loose entry exit protocols in the industry and somewhat fixed minimum wages. Hence, each retail outlet has to be equipped with the right number of employees to maximize headcount productivity and manage overheads in retail. The EXCEL sheet allows you to plan for surges in demand for employees especially during festive promotion periods. With the knowledge to preplan demand and cost variances- you can safeguard your profitability amongst cut-throat competition everywhere including online retail. Possible scenarios can be analyzed using the EXCEL spreadsheet.
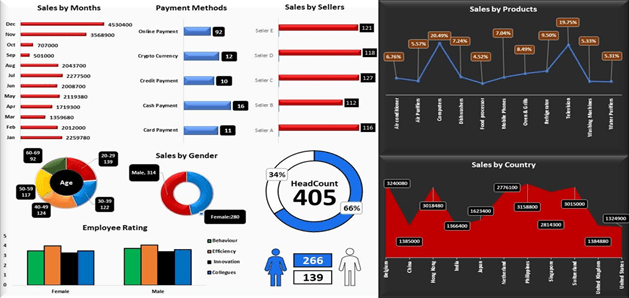
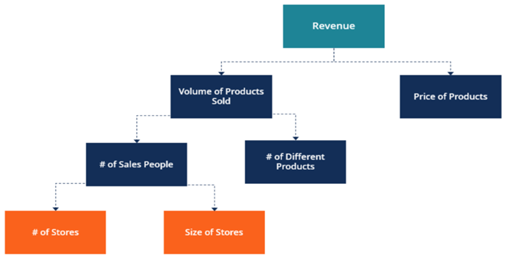
Other than this, number of stores which meet with KPIs and metrics, along with the size of each store (to be benchmarked against revenue), track the number headcount in operations and in sales for all stores across geographical boundaries, and the more common recording of sales, by volume and price of products per store, are all data sets that can be analyzed for improvements- cost savings, order a wider range of inventory or to train Floor Supervisors in monitoring team productivity on the service floor. Such information can be presented with charts, graphs, and tables.
Further comparison analytics, frequency charts and specific testing techniques such as deriving factor analysis for purchase decisions using T- test (test of hypotheses) using Formula and Function keys on the EXCEL spreadsheet.
With automation of the ‘Point of Sale’, huge amounts of data is collected, EXCEL is the platform which enables analyses of these data to turn it into information and intelligence that can be accessed through reporting dashboards.
ADVANCE EXCEL: The Tool
As the competency level indicates – Advance EXCEL is a spreadsheet for users who are somewhat proficient with basic skills. Although Advance EXCEL is not limited to financial analysis or academic research. Dynamic analysis is made possible with the various functions and formulae. Applied functions can be used in data representation by segments as pivot tables. Charts are the more common parts of the advance level learning which includes column, stacked column and waterfall illustrations. Some of the formula one will learn in Advance EXCEL includes topics such as Index and Match, the IF with AND/OR- scenario analysis, XNPV and XIRR- payment calculations and many more.
Key solution features on Advance EXCEL Spreadsheet
While anyone can use a simple SUM or IF formula, an advanced EXCEL learner will learn to combine formulas like SUMIFS, SUMPRODUCT, INDEX, MATCH, LOOKUP formulas. Knowledge to debug those formulas, audit and switch to the right formula for occasions and scenario analysis are alternative problem solution skills that will be picked up by learners.
Advance EXCEL offers a wide range of combinations for solutions to different users. In the Construction or Manufacturing sector. Advance EXCEL can be sometimes underutilized if you have no clue how to use the Power Query function to restructure your data.
With the stroke of a few keys, EXCEL will highlight portions of data that meets any given conditions, such as top project inventory required for phase 2 of the project. You may also combine formulas with conditional formatting function to highlight data that meets almost any condition.
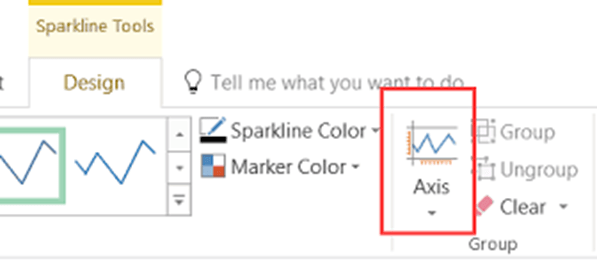
No amount of data is going to be able to convey compelling messages if they are left in the table format. Advance level EXCEL learners will be picking up Advanced Charting skills to present results in a stunning manner. One of those tools that you will learn is called Sparkline.
A large aspect of picking up Advance EXCEL skills is not possible without understanding Pivot Tables & Pivot Reporting.
Data analysis is made possible when relationships between those data makes sense. Such grouping of numerical value tied to characteristics of the information can be represented on a Pivot table. The analysis is carried out by measures of dissecting the data a certain point, to gain understanding of the different type of metrics used in data analysis. Illustrations of a Pivot table is used as pivot reporting to deduce findings, make recommendations and re-analyse those points to reaffirm findings. For most learners, reporting those filters from pivot table formulas such as slicers and timelines, does not constitute mastery of the subject until Advanced Pivot Table Skills is acquired.
A similar advance level extension to using EXCEL is VBA & Macros applications where these functions extend EXCEL’s functionality. VBA allows users to write instructions on macros to automate their work such as inventory orders and vendor payouts.
Conclusion
The extensions of an EXCEL spreadsheet maximizes workplace applications and it can be made easy. On the same note, shortcut features on mouse and on keyboard, will speed up EXCEL learning.
Advance EXCEL is a tool that helps garner data modelling to analyze massive amount of data for solutions. It helps to solve practical problems. Learner is able to run simulations for predictive scenarios, and study patterns with built in functions to the tables and data.
Advance EXCEL is a power tool for business owners and employees. It works like the “chain saw” for a lumberjack.